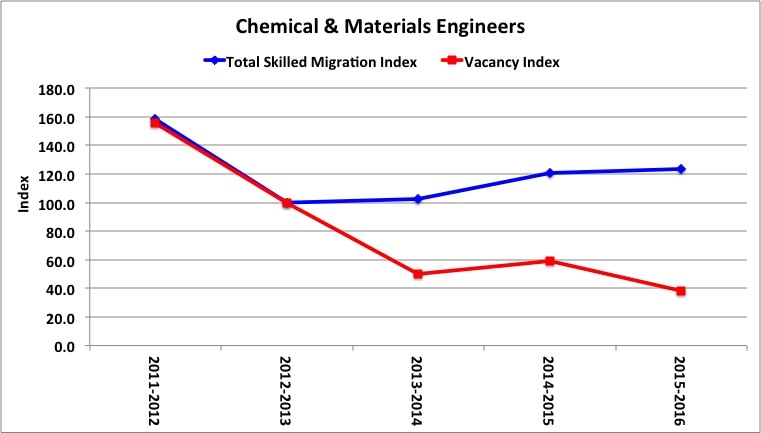
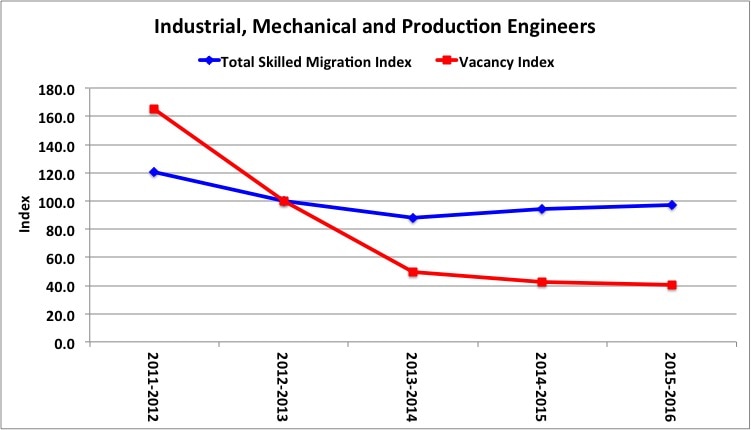
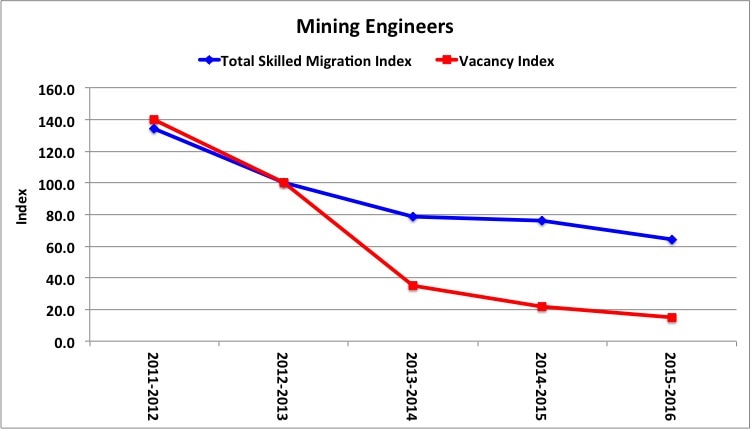
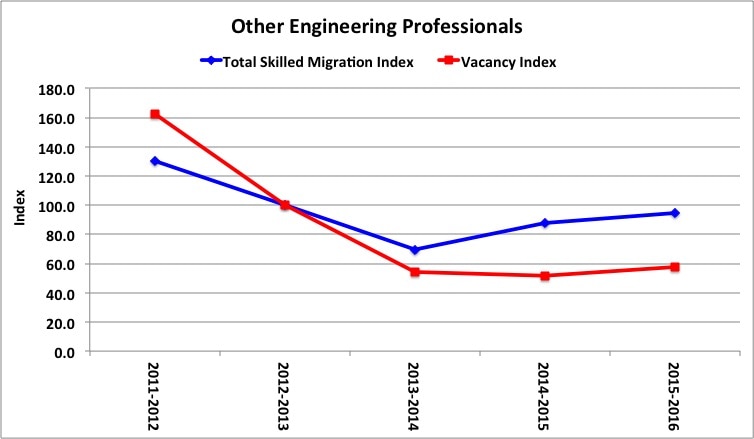
Migration Index compared with Vacancy Index
Index set to 100 in 2012-13 for both indices
There was no shortage of engineers in most
engineering Unit Groups in 2012-13
If the ratio of migrant engineers to job vacancies had
remained in balance since 2012-13, the blue and red
lines in the graphs below would be overlapping.
However, there is significant divergence between the
lines after 2012-13 because the Migration Index
exceeds the Vacancy Index in every case.
Sources
For all graphs:
Vacancies
Department of Employment, 2017, IVI Detailed Occupation Data - March 2016 Onwards. Available on the Department's Labour Market Information Portal.
Skilled Migration
Department of Immigration and Border Protection, 2017, BP0014 Temporary Work (Skilled) visas granted pivot table (Excel file).
Engineers Australia, 2017, The Engineering Profession: A Statistical Overview, Thirteenth Edition, February. Author: Andre Kaspura.
